reglscatterpy
Interactive WebGL scatterplots for single-cell / spatial data in Python —
AnnData, MuData, SpatialData, pandas and numpy. Renders millions of points
in the browser via regl-scatterplot,
in Jupyter, JupyterLab, VS Code and Colab.
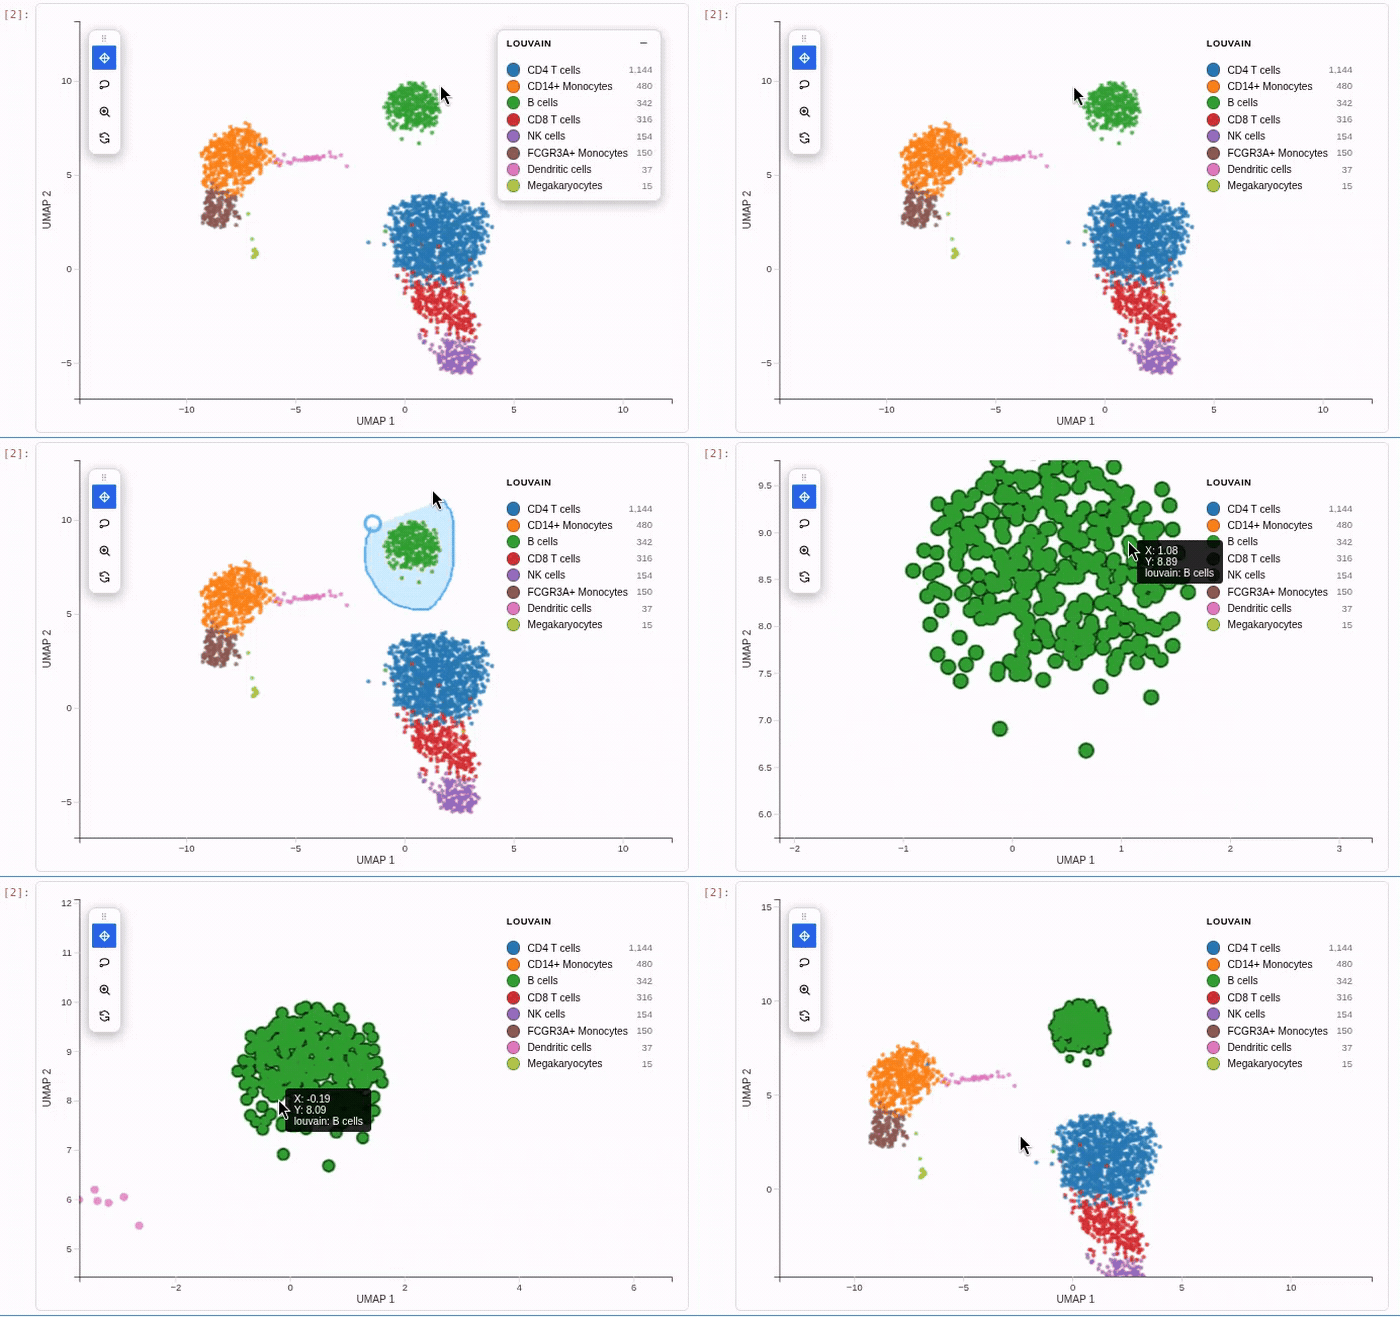
This is the Python companion to the R package reglScatterplotR — both drive the same compiled widget, so a plot looks and behaves identically across R and Python.
Install
30-second start
import scanpy as sc
import reglscatterpy as rs

adata = sc.datasets.pbmc3k_processed()
rs.scatterplot(adata, basis="umap", color="louvain")   # an obs column
rs.scatterplot(adata, basis="umap", color="CST3")      # a gene
Where to next
- :material-book-open-variant: **[User guide](guide.md)** — every feature with
runnable examples: big-data rendering, selection round-trip, annotate, DE,
linked grids, HTML export, embedding animations.
- :material-function: **[Functions API](api.md)** — `scatterplot()` and its 80+
arguments, plus `compose`, `save_html`, `record_html`, `extract`.
- :material-cursor-default-click: **[Widget object](widget-api.md)** — the live
widget's methods and properties (`selection`, `annotate`, `diff_expression`,
`composition`, `highlight`, `morph_to`, `to_html`).
Feature highlights
- Atlas-scale:
max_points="auto"density-subsamples while keeping rare cell types;max_points=Noneputs every cell on the GPU;progressive=Truedoes detail-on-zoom beyond ~4M cells. - Selection round-trip: lasso in the browser, read
w.selectionback in Python;annotate,diff_expression,compositionon the selection. - Linked grids:
color=[...]orbasis=[...]builds a synced multi-panel grid;compose([...])links arbitrary plots (camera + selection + filters). - Embedding animation:
w.morph_to("spatial")tweens points (and axes) from one embedding to another, preserving filter/selection/colour. - Offline export:
save_htmlwrites a self-contained interactive.html;record_htmlturns a whole notebook into a static report with no re-run.